Get summaries, questions, answers, solutions, notes, extras, PDF and guide of Class 11 (first year) Economics textbook, Introduction (Part A) of Introductory Microeconomics, which is part of the syllabus of students studying under AHSEC/ASSEB (Assam Board). These solutions, however, should only be treated as references and can be modified/changed.
If you notice any errors in the notes, please mention them in the comments
Summary
The chapter “Introduction” (Part A) of Introductory Microeconomics in the provided document gives a comprehensive overview of basic economic concepts. Economics, derived from the Greek words ‘Oikos’ (household) and ‘nomus’ (management), was initially defined as the science of household management. Over time, it evolved to encompass the study of wealth and the laws governing it. The modern definition, as introduced by Dr. Marshall in 1890, frames economics as a study of individual and collective economic activities, focusing on the production, distribution, and consumption of goods and services.
Economics can be divided into four main definitions: wealth, welfare, scarcity, and growth. Adam Smith, known as the father of modern economics, defined economics as the science of wealth, focusing on how nations can increase their wealth. His view was that economics is concerned with wealth-getting and wealth-using activities. This definition, however, was later expanded to include human welfare. Alfred Marshall emphasized that economics is also concerned with human welfare, not just wealth. His welfare definition posits that economics studies human well-being and the attainment and use of material requisites for it.
The scarcity definition, introduced by Lionel Robbins, describes economics as the study of human behavior as a relationship between ends and scarce means with alternative uses. This definition highlights that human wants are unlimited, resources are scarce, and these resources have alternative uses, necessitating choice and prioritization in their allocation. Paul Samuelson further expanded on this with the growth definition, which integrates the concepts of resource allocation, production over time, and distribution for present and future consumption, stressing economic growth and social welfare.
Economics is divided into microeconomics and macroeconomics. Microeconomics, from the Greek word ‘mikros’ meaning small, deals with the behavior and actions of individual economic units, such as consumers and firms. It focuses on the determination of prices and quantities in specific markets, considering the behavior of individual decision-makers. The scope of microeconomics includes product pricing, factor pricing, and economic welfare, explaining how resources are allocated to produce specific goods and services.
Macroeconomics, derived from the Greek word ‘makros’ meaning large, examines the economy as a whole. It addresses aggregate measures such as total output, employment, and the general price level. Macroeconomics analyzes overall economic behavior, including national income, aggregate demand, and supply, and the overall functioning of the economy.
Economics also differentiates between positive and normative economics. Positive economics describes and explains economic phenomena as they are, focusing on cause-and-effect relationships without making value judgments. For instance, it studies actual economic situations like income inequalities or inflation rates. In contrast, normative economics deals with what ought to be, providing prescriptions and recommendations based on value judgments. It evaluates economic policies and outcomes in terms of desirability, such as suggesting higher taxes for the rich or advocating for free education for the poor.
The concept of an economy encompasses all production units within a geographical area where people earn their living. These units include agricultural farms, factories, banks, schools, hospitals, and other institutions that produce goods and services, enabling people to earn income. Different economies are characterized by varying levels of state intervention and can be classified as capitalist (market economy), socialist (centrally planned economy), or mixed economies.
A capitalist or market economy is one where private individuals own and manage the means of production, guided by profit motives. Market forces of supply and demand determine the allocation of resources, prices, and production levels. The government does not interfere in economic activities, and decisions are driven by competition and the pursuit of profit.
In a centrally planned economy, the government owns and controls the means of production. Decisions regarding what, how, and for whom to produce are made by central authorities with the aim of maximizing social welfare. Production is based on planned targets rather than market signals, and resources are allocated according to the central plan.
A mixed economy incorporates elements of both market and planned economies. Certain sectors are left to market forces, while others, such as public utilities and essential services, are managed by the government to ensure social welfare. This system allows for profit-driven production while also addressing social goals.
The chapter further explores the central problems of an economy, which are what to produce, how to produce, and for whom to produce. These problems arise due to limited resources and the need to allocate them efficiently. The production possibility curve (PPC) is a graphical representation that shows the maximum possible output combinations of two goods that can be produced with available resources and technology. Points on the PPC represent efficient use of resources, while points inside indicate underutilization, and points outside are unattainable with current resources.
The concept of opportunity cost is illustrated through the PPC, emphasizing that producing more of one good requires sacrificing some quantity of another due to limited resources. This trade-off is fundamental to economic decision-making, highlighting the importance of prioritizing certain goods over others based on their opportunity costs.

Video tutorial
Textbook solutions
Very Short Answer Type Questions
1. Define Economics.
Answer: Economics is the science which studies human behavior as a relationship between ends and scarce means which have alternative uses.
2. Define microeconomics.
Answer: Microeconomics deals with analysis of behavior and economic actions of small and individual units of the economy, like a particular consumer, a firm, or a small group of individual units.
3. Define macroeconomics.
Answer: Macroeconomics is the branch of economics that studies the behavior and performance of an economy as a whole, focusing on aggregate changes in the economy such as unemployment, growth rate, gross domestic product, and inflation.
4. Give two examples of microeconomic studies.
Answer:
- Household expenditure
- Price determination of a product
5. Give two examples of macroeconomic studies.
Answer:
- Inflow or outflow of foreign exchange
- Aggregate demand
6. Give one point of difference between microeconomics and macroeconomics.
Answer: Microeconomics studies the behavior of individual units of an economy, while macroeconomics studies the economy as a whole by focusing on aggregate measures.
7. Why does an individual need resources?
Answer: An individual needs resources to satisfy human wants directly or indirectly.
8. What is the problem of choice?
Answer: The problem of choice arises because of scarcity of resources which have alternative uses, in relation to unlimited wants.
9. Mention the factor that gives rise to the problem of choice in economies.
Answer: The factor that gives rise to the problem of choice in economies is the scarcity of resources.
10. What is meant by the problem of allocation of resources?
Answer: The problem of allocation of resources refers to deciding how to distribute the available scarce resources among different uses.
11. What is meant by production possibility curve?
Answer: The production possibility frontier gives the combinations of two goods that can be produced when the resources of the economy are fully utilized. A point on the PPC indicates full employment and efficient utilization of resources.
12. What does the slope of PPC show?
Answer: The slope of the PPC is a downward sloping concave shaped curve. Its downward slope indicates that more of one good can be produced only by taking resources away from the production of another good. Its concave shape indicates that more and more units of one commodity have to be sacrificed to gain an additional unit of another commodity.
13. Give one reason for a rightward shift of the production possibility curve.
Answer: If there is growth of resources and technological progress, PPC shifts outward (or rightward).
14. Define opportunity cost.
Answer: Opportunity cost is the value of the next best alternative foregone when availing a particular alternative.
15. Define marginal rate of transformation.
Answer: Marginal rate of transformation (MRT) is the amount of units of one good sacrificed to produce one more unit of the other good.
16. What is a market economy?
Answer: A market economy (or a capitalist economy) is a free economy in which all economic activities are organized on the basis of market demand and market supply. The economy freely operates through price mechanism.
17. What is a mixed economy?
Answer: A mixed economy is the one which has the characteristics features of a free economy as well as a planned economy. The central problems (what, how and for whom to produce) are not entirely left to the free play of market forces.
18. What is a centrally planned economy?
Answer: A centrally planned economy is one in which all economic activities are organized/decided by the central authority or the government. In it, resources are owned by the government and the motive of production is to maximize social welfare.
19. Is Indian economy a centrally planned economy?
Answer: No, the Indian economy is not a centrally planned economy. It is a mixed economy.
20. Choose the correct answer. In a centrally planned economy, all the important decisions regarding production, exchange, consumption etc. are made by the __________: (a) Central bank (b) Market (c) Government
Answer: (c) Government
21. Choose the correct answer. In reality __________ all economies are: (a) Socialistic (b) Mixed (c) Capitalistic
Answer: (b) Mixed
22. Fill in the blank. In ___________ economic analysis, we study how the different mechanisms function.
Answer: positive
Short Answer Type Questions
1. What is meant by the production possibility curve?
Answer: The production possibility frontier gives the combinations of two goods that can be produced when the resources of the economy are fully utilized. A point on the PPC indicates full employment and efficient utilization of resources.
2. What does the slope of the PPC show?
Answer: The PPC is a downward sloping concave shaped curve. Its downward slope indicates that more of one good can be produced only by taking resources away from the production of another good. Its concave shape indicates that more and more units of one commodity have to be sacrificed to gain an additional unit of another commodity.
3. Give one reason for a rightward shift of the production possibility curve.
Answer: If there is growth of resources and technological progress, PPC shifts outward (or rightward).
4. Define opportunity cost.
Answer: Opportunity cost is the cost of availing one opportunity in terms of the loss of another opportunity.
5. What is a market economy?
Answer: A market economy (or a capitalist economy) is a free economy in which all economic activities are organized on the basis of market demand and market supply. The economy freely operates through price mechanism. Private property and profit motive are the two key features of a market economy.
6. What is a mixed economy?
Answer: Mixed Economy: is the one which has the characteristic features of a free economy as well as a planned economy. The central problems (what, how, and for whom to produce) are not entirely left to the free play of market forces. The goal of profit maximization is allowed to be pursued, but not at the cost of social justice.
7. What is a centrally planned economy?
Answer: A centrally planned economy is one in which all economic activities are organized/decided by the Central Authority or the government. In it, resources are owned by the government and the motive of production is to maximize social welfare.
8. Is the Indian economy a centrally planned economy?
Answer: No, the Indian economy is not a centrally planned economy. It is a mixed economy with both government and private sector participation.
9. Explain the concept of opportunity cost with an example.
Answer: Opportunity cost of a given activity is defined as the value of the next best activity. It is also called alternative cost. Example, suppose that you are a doctor having a private clinic in New Delhi and your annual earnings are 12 lakhs. There are two other alternatives to having a clinic in New Delhi. Either you can work in a government hospital in New Delhi, earning 10 lakhs per annum or you can open a clinic outside your hometown, which would have generated an annual income of 8 lakhs. Then your opportunity cost of having a clinic in New Delhi is 10 lakhs.
10. What does a point below PPC indicate?
Answer: It indicates under-utilization and inefficient use of the economy’s resources.
11. Define marginal opportunity cost.
Answer: Marginal opportunity cost (or marginal rate of transformation) is the amount of units of one good sacrificed to produce one more unit of the other good.
12. What does the slope of PPF indicate?
Answer: The slope of PPF indicates that more of one good can be produced only by taking resources away from the production of another good. Its concave shape indicates that more and more units of one commodity have to be sacrificed to gain an additional unit of another commodity.
13. Define the Production Possibilities curve.
Answer: The production possibility frontier gives the combinations of two goods that can be produced when the resources of the economy are fully utilized. A point on PPC indicates full employment and efficient utilization of resources.
14. Does production necessarily take place on a production possibility curve? Explain.
Answer: Production does not necessarily take place on PPC. It will take place on PPC only when given resources are fully and efficiently utilized. When resources are under-employed or inefficiently used in an economy, then production will not take place on PPC. It will take place somewhere below the PPC.
15. What does a production possibility curve show? When will it shift to the right?
Answer: The production possibility curve shows society’s menu of choices. It indicates that an increase in the output of one commodity leads to a fall in the output of another commodity. Thus some amounts of one commodity get transformed into some quantity of another commodity. That is why PPC is also called the transformation curve. If there is growth of resources and technological progress, PPC shifts outward (or rightward).
16. Define marginal rate of transformation.
Answer: Marginal opportunity cost (or marginal rate of transformation) is the amount of units of one good sacrificed to produce one more unit of the other good.
17. Define production possibilities curve. Explain why it is downward sloping from left to right.
Answer: The production possibility frontier gives the combinations of two goods that can be produced when the resources of the economy are fully utilized. A point on PPC indicates full employment and efficient utilization of resources. A production possibility curve slopes downward from left to right. This implies that in order to produce more of one good, some units of the other good must be sacrificed. The negative slope of PPC shows the opportunity cost of the extra output of a good.
18. Why is the production possibility frontier called the opportunity cost curve?
Answer: The PPC is also called an opportunity cost curve as it measures the opportunity cost of one good in terms of the alternative good given up. More of one good can be produced only if resources are withdrawn from the production of the other good. The opportunity cost is shown by the negative slope of the PPC.
Long Answer Type Questions:
1. Distinguish between microeconomics and macroeconomics.
Answer: Microeconomics is that part of economic theory which studies the behaviour of individual units of an economy, e.g., a firm, a household, etc. It aims to determine the price of a commodity or factors of production. It assumes all the macro variables remain constant. It is also known as ‘Price Theory’.
Macroeconomics is that part of economic theory which studies the behaviour of aggregates of the economy as a whole. It aims to determine the aggregate output (national income) and employment level of the economy. It assumes that all the micro variables (distribution of income) remain constant when we are studying the level of output. It is also known as ‘Income and Employment Theory’ .
2. Differentiate between a market economy and a centrally planned economy.
Answer: A market economy (or a capitalist economy) is a free economy in which all economic activities are organised on the basis of market demand and market supply. The economy freely operates through the price mechanism. Private property and profit motive are the two key features of a market economy.
A centrally planned economy is one in which all economic activities are organised/decided by the central authority or the government. In it, resources are owned by the government, and the motive of production is to maximise social welfare .
3. Explain the shape of a typical production possibilities frontier, stating its characteristics.
Answer: A typical production possibility frontier (PPF) has the following characteristics:
- Downward Sloping from Left to Right: This implies that to produce more of one good, some units of the other good must be sacrificed. For example, moving downward along the PPC from point A to B and then from B to C, the output of wheat reduces as the output of cloth increases. This results in the loss of wheat production. The negative slope of PPC shows the opportunity cost of extra output of a good. That is why PPC is also called the opportunity cost curve.
- Concave to the Point of Origin: This shape shows the operation of the law of increasing marginal opportunity cost. Marginal opportunity cost along a PPC is defined as the amount of one good that needs to be sacrificed per unit increase in the production of the other good. For instance, if the economy functions at point A initially, it produces 15 thousand quintals of wheat and no cloth. To produce one thousand meters of cloth, the economy foregoes one thousand quintals of wheat. As the economy moves from point B to C, 2 thousand quintals of wheat would be sacrificed. Hence, marginal opportunity cost increases .
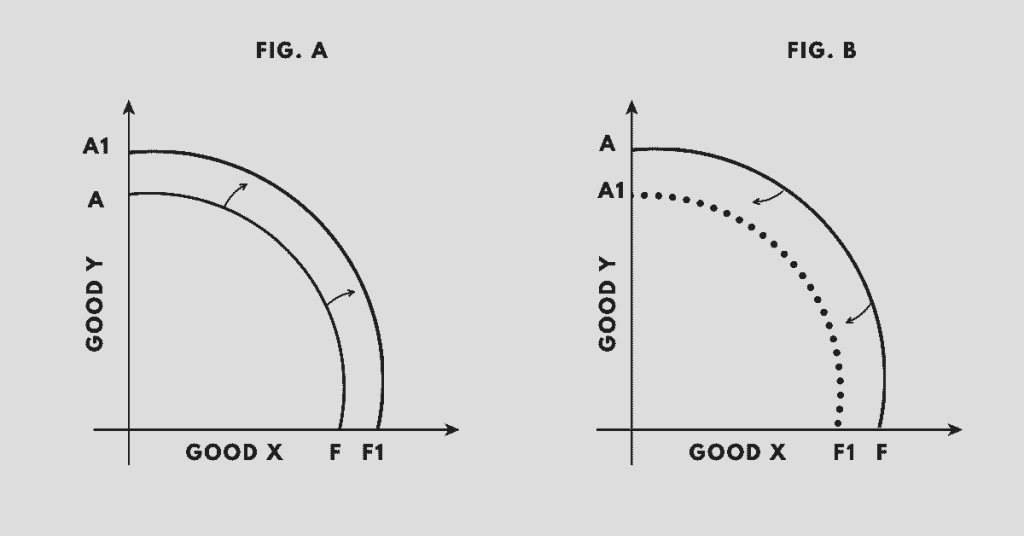
4. Can the PPF shift? Explain with diagram.
Answer: A production possibility curve is based on the assumption that resources remain unchanged. If there is growth of resources, this assumption is broken and the existing PPC is no longer valid. The new PPC now shifts outward (or rightward). The resources of an economy grow due to (a) discovery of new natural resources (b) increase in the supply of labour (skilled/unskilled) and (c) availability of new and better technology. The economy can produce more of both or all goods. In such a situation, PPC shifts to the right as shown in Fig. A.
This diagram shows that due to improvement in the technique of production or growth of resources of the economy, the PPC has shifted to the right from AF to A₁F₁, due to which the economy can produce more amount of both the goods.
The PPC can also shift to the left if the resources decrease. It is a rare possibility but sometimes it may happen due to fall in population, due to destruction of capital stock caused by large scale natural calamities, wars etc. In such a situation the PPC shifts inward as shown by dotted line A₁F₁ in Fig. B.
It may here be noted that if an economy makes advancement in technology but restricted to only one commodity, the PPC shifts upwards in favour of that commodity. Suppose the advancement in technology takes place only in wheat production, the PPC will shifts from OA to OA₁ by using the given amount of resources. The production of cloth remains unchanged.
5. Explain two characteristics or properties of production possibilities curve.
Answer:
- Downward Sloping from Left to Right: This implies that to produce more of one good, some units of the other good must be sacrificed. This reflects the opportunity cost of producing more of one good.
- Concave to the Point of Origin: The PPC is concave due to the law of increasing marginal opportunity cost. As more resources are allocated to produce one good, increasingly larger amounts of the other good must be sacrificed, reflecting the inefficiency in resource reallocation
6. Define Marginal Rate of Transformation (MRT). Calculate MRT from the following production possibilities schedule of an economy which produces only two goods – Corn and Cotton. Also, draw the PPC. Explain its shape.
Answer: Marginal Rate of Transformation (MRT) is the rate at which one good must be sacrificed in order to produce an additional unit of another good. It is calculated by taking the absolute value of the slope of the production possibility curve (PPC).
Given the production possibilities schedule:
| Possibilities | Cotton | Corn |
|---|---|---|
| A | 10 | 0 |
| B | 9 | 1 |
| C | 7 | 2 |
| D | 4 | 3 |
| E | 0 | 4 |
To calculate MRT:
- From A to B: MRT = (10-9)/(1-0) = 1
- From B to C: MRT = (9-7)/(2-1) = 2
- From C to D: MRT = (7-4)/(3-2) = 3
- From D to E: MRT = (4-0)/(4-3) = 4
The MRT is increasing, indicating that more and more units of cotton need to be sacrificed to produce additional units of corn.
Here is the PPC diagram to illustrate this schedule:
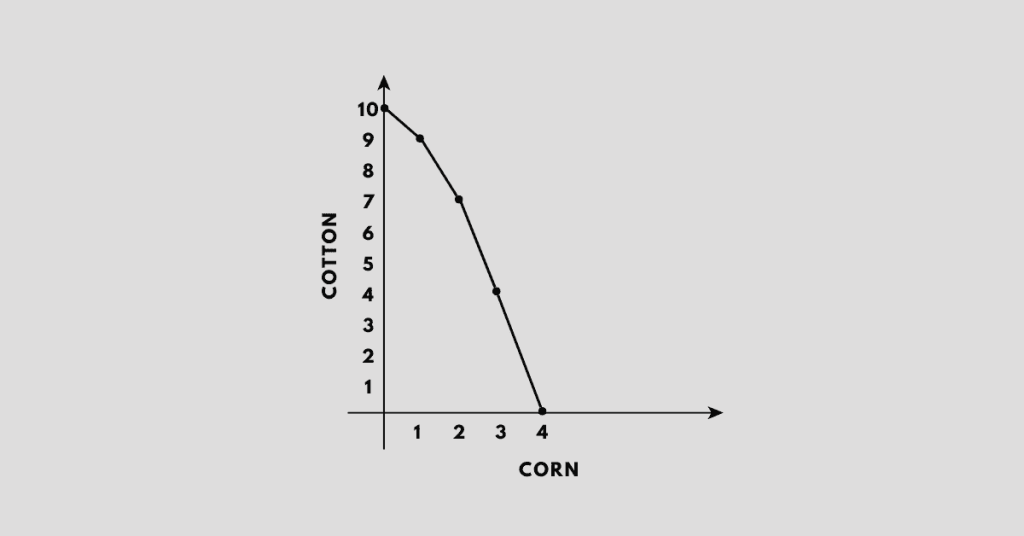
The shape of the PPC is concave to the origin. This concave shape reflects the increasing opportunity cost; as the production of one good increases, the economy must give up increasing amounts of the other good due to the reallocation of resources that are not equally efficient in producing both goods.
7. Define production possibility curve and show the following situations on the diagram. (a) Problem of scarcity (b) Problem of underutilization of resources (c) Full employment of resources.
Answer:
The Production Possibility Curve (PPC) is a graphical representation of the possible combinations of two goods that an economy can produce with the available resources and technology, assuming that all resources are fully and efficiently utilized.
(a) Problem of scarcity: This is represented by points outside the PPC, indicating combinations of goods that are not attainable with the current resources and technology.
(b) Problem of underutilization of resources: This is represented by points inside the PPC, indicating that resources are not being used efficiently.
(c) Full employment of resources: This is represented by any point on the PPC, indicating that resources are being used efficiently to produce a combination of goods.
Here is the diagram to illustrate these situations:
8. State the central problems of an economy. Why do they arise?
Answer: The central problems of an economy are:
- What to produce: Deciding which goods and services should be produced.
- How to produce: Determining the method of production (labour-intensive or capital-intensive).
- For whom to produce: Deciding the distribution of produced goods and services among the population.
These problems arise due to the scarcity of resources and the need to make choices between alternative uses of these resources. The limited availability of resources compared to unlimited wants necessitates making decisions on allocation and distribution .
9. Why do central problems arise? Explain the problem of allocation of resources.
Answer: Central problems arise due to the scarcity of resources, which have alternative uses. These problems include deciding what to produce, how to produce, and for whom to produce. The allocation of resources involves deciding the best possible use of limited resources among competing ends. This requires efficient resource use to maximize production and satisfy human wants.
The problem of allocation of resources is fundamental to an economy because resources are limited while human wants are unlimited. This problem includes:
- What to Produce: Deciding which goods and services should be produced and in what quantities. This involves choosing between different products and services, such as consumer goods and capital goods.
- How to Produce: Determining the methods or techniques of production. This involves choosing between labor-intensive methods (using more labor and less capital) and capital-intensive methods (using more capital and less labor).
- For Whom to Produce: Deciding how the goods and services produced are distributed among the population. This involves determining who gets what share of the total output, considering factors like income distribution, social welfare, and economic equity.
10. Explain how does a market economy solve the central problems of the economy.
Answer: In a market economy, central problems are solved through the price mechanism. The market price, determined by the free market forces of demand and supply, guides producers on what, how, and for whom to produce. Producers and consumers interact in the market, and the prices act as signals for the allocation of resources. The decisions on production and consumption are decentralized, meaning they are made by individual producers and consumers based on their preferences and resources. This leads to an efficient allocation of resources, as goods and services are produced according to consumer demand, and resources are utilized where they are most valued. The profit motive drives producers to minimize costs and innovate, leading to economic growth and development.
Extra questions and answers
1. What does ‘Economics’ mean and from which Greek words is it derived?
Answer: Economics has been derived from two Greek words – ‘Oikos’ and ‘nomus’. Oikos means household and nomus means management.
54. What happens if there is an advancement in technology restricted to only one commodity according to the Production Possibility Curve?
Answer: If there is an advancement in technology restricted to only one commodity, the Production Possibility Curve shifts upwards in favour of that commodity. For example, if the advancement in technology occurs only in wheat production, the PPC will shift from OA to OA1, indicating an increased production of wheat while the production of cloth remains unchanged.

Get notes of other boards, classes, and subjects