Here, you will find summaries, questions, answers, textbook solutions, pdf, extras etc. of (Nagaland Board) NBSE Class 11 Education Chapter 12: Introduction to Statistics in Education. These solutions, however, should be only treated as references and can be modified/changed.
Introduction
Statistics, the science of collecting, analyzing, and interpreting data, plays a pivotal role in various fields, including education. It provides a quantitative foundation for educational research and policy, enabling us to make informed decisions based on empirical evidence.
One of the significant uses of statistics in education is predicting future academic performance. By analyzing past and present data, educators and policymakers can forecast trends, helping them make strategic decisions about resource allocation and curriculum development. Moreover, statistics can establish relationships between different variables, such as the correlation between students’ attendance and their academic performance.
Statistics also assist governments in policy formulation. For instance, when planning to implement free education, statistical data can provide answers to critical questions like the number of schools required or the number of teachers to be appointed. This data-driven approach ensures that policies are practical, feasible, and tailored to the population’s needs.
Furthermore, statistics simplify complex data, making it easier to understand. Complex data, when expressed in graphs, diagrams, averages, or percentages, becomes more digestible, facilitating better comprehension among students and educators alike. This simplification is particularly beneficial in subjects like commerce and economics, where data interpretation is crucial.
Visual representation of data, such as histograms and frequency polygons, further enhances our understanding of statistics. A histogram, which represents class frequencies by vertical rectangles, provides a visual interpretation of data distribution. On the other hand, a frequency polygon, a line graph plotted against class mark, offers a different perspective on data distribution. Both these tools, while different in their representation, provide valuable insights into the data, making statistics a powerful tool in education.
Textual questions and answers
Very Short Answer Type Questions
1. What is statistics?
Answer: Statistics is the science which deals with methods of collection, presentation, analysis and interpretation of quantitative measurement.
2. What is data?
Answer: Data means a collection of any number of related observations.
3. Explain statistics in (i) singular sense (ii) plural sense.
Answer: (i) Statistics in singular sense means the science dealing with tabulation, classification, analysis and interpretation of numerical facts.
(ii) Statistics in plural sense means numerical facts systematically collected. It indicates information in terms of numbers or numerical data such as employment statistics or population statistics.
4. What is a Bar Chart?
Answer: A bar chart is a graph that consists of a number of rectangles of equal width (base) but length or height of the rectangle is proportional to the value they represent.
5. What is a Histogram?
Answer: Histogram is defined as a graph that represents the class frequencies in a frequency distribution by vertical rectangles.
6. What is frequency polygon?
Answer: Frequency polygon is a line graph of class frequency plotted against class mark.
Short Answer Type Questions
1. Mention four functions of statistics.
Answer: Four functions of statistics are as under:
- It simplifies complex data.
- It presents data in comparable forms.
- It helps in finding out the causes of changes with the comparison of past and present results.
- It helps in extracting relevant and accurate information from data.
2. Discuss the important methods of collecting data.
Answer: The important methods of collecting data are:
- Direct Personal Interview: In this method the investigator personally interviews someone who is in a position to supply required information.
- Indirect Personal Interview: In this method the investigator interviews the persons who have the knowledge of relevant matter or event to collect required data.
- Information from Correspondents: In this method local agents are appointed in different parts and phases of investigation to collect data and the collected data is used.
- Mailed questionnaires: Here questionnaires are sent by post to persons for collecting information, with a request to answer and return it within a specified time.
3. Differentiate between primary source and secondary source of data.
Answer: Primary source of data is referred to the data collected and issued by the same source or agency. Secondary source of data is referred to as the data published or used by one source or agency or organisation, but originally collected and compiled by some other source or agency.
4. Explain Tabulation.
Answer: Tabulation is a systematic presentation of numerical data in rows and columns related with some important characteristics and features. Data is tabulated to simplify the complex data for comparison.
Long Answer Type Questions
1. Discuss the uses of statistics.
Answer: The uses of statistics are as follows:
- Statistics helps us to predict the future academic performance of educational institutions on the basis of present and past data.
- Statistics helps us to find a relation between two or more variables.
- It helps the government to collect information from various quarters in order to formulate any policy.
- The government wants to make education free. Then how many schools are required? How many teachers to be appointed? All these questions can be answered with the help of statistics.
- Statistical data is essential in every walk of life. No field of study is complete without statistics.
- Students can better understand the subjects like commerce, economics, education etc., with the help of statistics.
- Statistics simplifies complex data. When a complex data is expressed in graphs, diagrams, curves, averages, percentage etc., it becomes easy to understand.
- Statistics helps in economic planning.
- School results can easily be compared with past and present results and with the results of other schools with the help of data graphs/diagrams.
- Statistics is useful in analysis, interpretation and tabulation.
2. Discuss the important functions of statistics.
Answer: The functions of statistics are as under :
- It simplifies complex data.
- It presents data in comparable forms.
- It helps in finding out the causes of changes with the comparison of past and present results.
- It helps in extracting relevant and accurate information from data.
- It helps to summarise results.
- It helps to make prediction of what will happen under a given condition. 7. It helps to measure the achievement of students in different subjects.
- It helps to know the strengths and limitations according to which further help for providing educational and vocational guidance can be decided.
- It helps in classification of various activities.
- It helps to find out Intelligence Quotient (I.Q.) of students.
- It helps to find Educational Quotient (E.Q.) of students.
- It helps the teachers to improve their method of teaching.
- It helps to maintain students’ progress records.
- Statistics enables to summarise the results in meaningful and convenient form.
- It helps to reach a general conclusion.
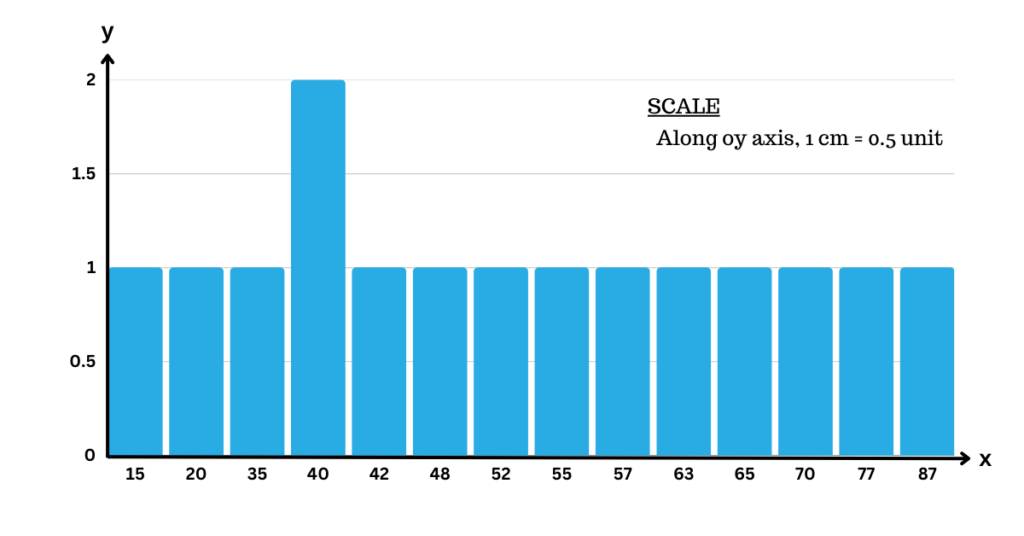
3. Make a frequency table and Bar Chart of the marks obtained out of 100 by 15 students of class XI in English as given below.
87, 57, 20, 15, 35, 77, 63, 42, 55, 48, 52, 65, 70, 40, 40
Answer:
| Marks | Frequency |
| 15 | 1 |
| 20 | 1 |
| 35 | 1 |
| 40 | 2 |
| 42 | 1 |
| 48 | 1 |
| 52 | 1 |
| 55 | 1 |
| 57 | 1 |
| 63 | 1 |
| 65 | 1 |
| 70 | 1 |
| 77 | 1 |
| 87 | 1 |
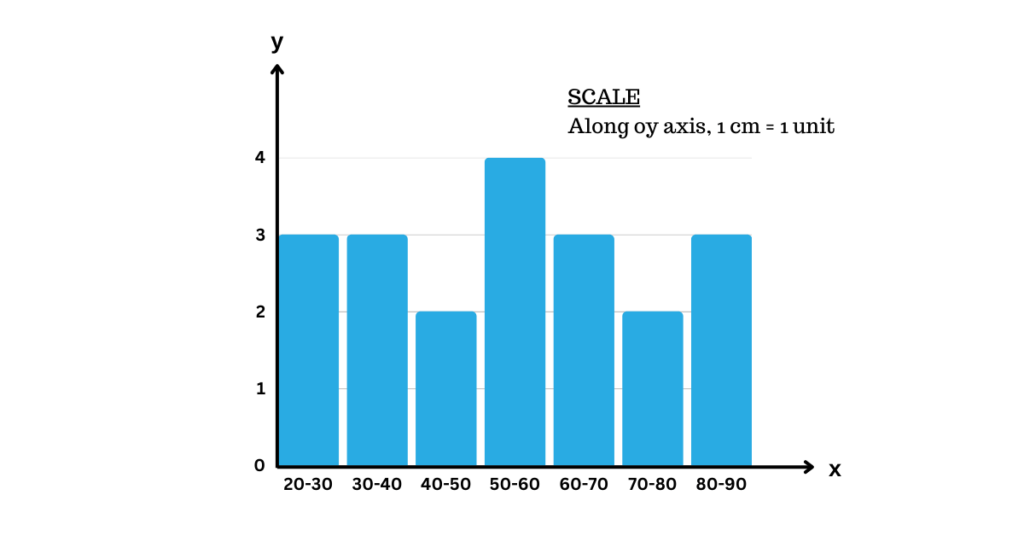
4. Prepare a frequency distribution table and histogram from the given data. Marks obtained by 20 students of Class XI are as under:
85 75 65 25 45
57 67 77 27 37
72 22 42 82 62
66 76 56 36 55
Answer:
| Marks Range | Frequency |
| 20-30 | 3 |
| 30-40 | 3 |
| 40-50 | 2 |
| 50-60 | 4 |
| 60-70 | 3 |
| 70-80 | 2 |
| 80-90 | 3 |
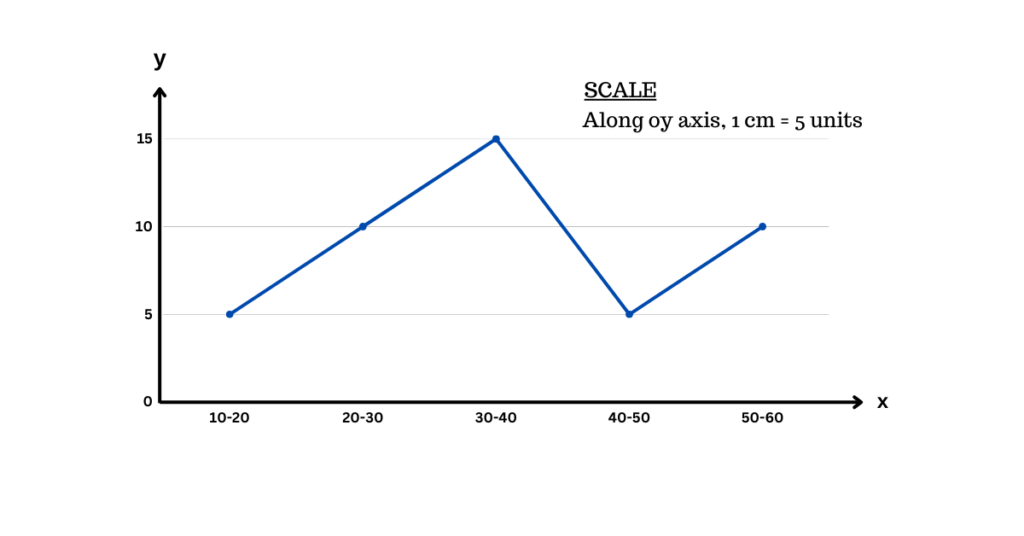
5. Prepare a frequency polygon of the following data.
| Marks | 10-20 | 20-30 | 30-40 | 40-50 | 50-60 |
| No. of students | 5 | 10 | 15 | 5 | 10 |
Answer:
Higher Order Thinking Skills (HOTS) Questions
1. Discuss the importance of statistics in the field of education.
Answer: Statistics helps us to predict the future academic performance of educational institutions on the basis of present and past data. It helps us to find a relation between two or more variables. It helps the government to collect information from various quarters in order to formulate any policy. For instance, if the government wants to make education free, statistics can answer questions such as how many schools are required and how many teachers need to be appointed. Statistical data is essential in every walk of life and no field of study is complete without statistics. Students can better understand the subjects like commerce, economics, education etc., with the help of statistics. Statistics simplifies complex data. When a complex data is expressed in graphs, diagrams, curves, averages, percentage etc., it becomes easy to understand. Statistics also helps in economic planning.
2. How Frequency Polygon is different from histogram? Explain.
Answer: A Frequency Polygon is a line graph of class frequency plotted against class mark. It can be obtained by two methods: by using a Histogram or without using a Histogram. When using a Histogram, the mid-points of the upper horizontal sides of each rectangle are joined by dotted lines. The mid-points of two class intervals of zero frequency, one adjacent to the first on its left and another adjacent to the last, on its right, are obtained. The polygon is completed by joining the mid-points of first and last class intervals to the mid-point of the imagined class intervals adjacent to them.
On the other hand, a Histogram is a graph that represents the class frequencies in a frequency distribution by vertical rectangles. The basic rules for constructing histograms are similar to those for bar graphs, except that the data to be illustrated as the histograms is in the form of a frequency distribution table, where we have class intervals instead of discrete variables and frequency in place of the value of the variable. Here, class intervals form the base of the bars or rectangles and the frequency of the class intervals will form the height of the rectangle. For equal class intervals, the width of the rectangles will be equal. As the class intervals are continuous, the rectangles will be adjacent to each other without a gap between them.
Additional/extra questions and answers
1. What is the origin of the word ‘statistics’?
Answer: The word ‘statistics’ is derived from the Latin term ‘statisticum collegium’ which means a lecture on the state of affairs. This term was used for the first time by German mathematician Gottfried Achenwall in 1749.
2. What is the meaning of the term ‘Statistics’ according to the old records?
Answer: In old times, the term ‘Statistics’ referred to numerical descriptions of quantitative aspects of things, such as count and measurement. Numerical records were maintained regarding divisions of state, their population, birth rate, and income, which is part of statistics.
3. What are the key tasks involved in the science of statistics?
Answer: Statistics involves several key tasks including the collection of data, which is the process of procuring measurements or counts; organisation of data, which is presenting the collected measurements or counts in a suitable form; analysis of data, which involves computation of means and degrees of variation; and interpretation of data, which is discovering the cause-effect relationship between various types of data and the inferences.
4. What are the definitions of ‘Statistics’ according to Horace Secrist and Bowley?
Answer: According to Horace Secrist, “Statistics is an aggregate of facts affected to a marked extent by multiplicity of causes, numerically expressed, enumerated or estimated according to a reasonable standard of accuracy, collected in systematic manner for a predetermined purpose and placed in relation to each other”. On the other hand, Bowley defines statistics as “numerical statement of facts in any department of enquiry placed in relation to each other”.
5. What is the general understanding of ‘Statistics’ for an ordinary person?
Answer: For an ordinary person, ‘Statistics’ means data. This data refers to a collection of any number of related observations, such as the percentage of students who scored the first division in higher secondary arts stream under Nagaland Board of School Education in 2014.
27. Explain the process of constructing a frequency polygon without using a histogram.
Answer: To construct a frequency polygon without a histogram, the following steps are followed:
- Class marks (mid-points of class intervals) x1, x2,…, xn of the given class intervals are calculated using the formula: Class mark= (Upper limit + Lower limit)/2
- Mark x1, x2………….xn , along x-axis. Mark the frequencies f1, 2, f, along y-axis.
- Plot the points (x1, fj), (x2, f2), (x, f)
- Join these points (x1, 1), (x2, 2),…,(x, f) by the line segments.
- Take two class intervals of zero frequency, one at the beginning and other at the end. Obtain their mid-points.
- Complete the frequency polygon by joining the mid-points of the first and last intervals to the mid-point of the imagined classes adjacent to them.
This creates a polygonal line, thus forming the frequency polygon. The polygon provides a visual representation of the data, making it easier to understand the overall distribution.
Additional/extra MCQs
1. From which language is the term ‘statistics’ derived?
A. German B. Latin C. French D. Greek
Answer: B. Latin
2. Who first used the word ‘Statistics’?
A. Horace Secrist B. Bowley C. Gottfried Achenwall D. Aristotle
Answer: C. Gottfried Achenwall
3. In what year was the word ‘Statistics’ first used by Gottfried Achenwall?
A. 1849 B. 1749 C. 1649 D. 1949
Answer: B. 1749
4. What does the process of ‘collection of data’ involve?
A. Procurement of measurements or counts B. Numerical statement of facts C. Aggregation of facts D. Organisation of numerical facts
Answer: A. Procurement of measurements or counts
5. What does the ‘organisation of data’ refer to?
A. Presentation of measurements in a suitable form B. Numerical description of quantitative aspects C. Collection of data in a systematic manner D. Interpretation of data
Answer: A. Presentation of measurements in a suitable form
40. What is the formula for calculating the class mark?
A. Upper limit – Lower limit/2 B. Upper limit + Lower limit*2 C. Upper limit + Lower limit/2 D. Upper limit / Lower limit
Answer: C. Upper limit + Lower limit/2
Get notes of other boards, classes, and subjects